Numbers don’t actually exist. There is no actual number three somewhere. It is not a thing. There is just ‘threeness’, a relationship between things that we learn to recognise; that this small cluster of cubes is similar to that small cluster of counters in a way we learn to call ‘three’. The cubes themselves are not three; we declare their threeness when they are associated together in a certain way. We learn what three means through repeated exposure to clusters exemplifying this relationship and thus come to learn what three and not-three look like. But there is no spatiotemporally locatable prototype ‘three’ against which all other instances of three can be verified.
Pupil progress is a bit like that. We tend to act as if ‘Progress’ is a real, tangible thing that really exists. Worse than that, we even believe that we can measure it. This is an illusion.
It is, however, incredibly useful to have a word to describe ‘the process of gradually improving or getting nearer to achieving or completing something’ in the same way that it is even more useful to have the concept ‘three’. So what’s my problem? Is this just an exercise in clever semantics? My point is that progress isn’t a generalizable thing that exists independent of a highly specific context, a point that seems obvious. Yet the assumption that ‘Progress’ can be reduced to one, measurable thing that can or cannot be found hidden inside pupils’ exercise books or test scores is the basis of the panoply of accountability; all those graphs and charts and spreadsheets purporting to ‘measure’ something. What then, we may ask, is the unit of measurement? The microGove perhaps[1]?
Of course we can look at pupils’ work over a period of time and see if they are getting better at the things we want them to get better at. Indeed, it is really important that we do, because if they are not getting better then there’s a problem of some sort that we need to get to the bottom of and then remediate. So we need to be clear about what we want them to improve. Generally, this is to do with either knowing more stuff or knowing how to do certain stuff or knowing how and when to do certain stuff rather than others. So we will listen to pupils’ answers and read their work and set them tests to find out if what we are teaching them is sticking. And if it is we will be pleased that they are making progress, maybe even good progress. But the improvement they make in their times table test scores and the improvements they make in knowing more about the water cycle or using fronted adverbials in their writing are just not commensurate. That would be like trying to compare mass with colour intensity or length with electrical charge.
Even Ofsted High Command are trying to move away from the idea that you can ‘measure’ progress. The Ofsted Handbook, the report of the Commission on Assessment without Levels, the data management report from the Workload review group all say the same thing; you need to be able to show progress, but that does not mean you have to be able to quantify it.[2] Here’s a brief selection (courtesy of James Pembroke and Gaz Needle) from those listed above, saying just this.

Inspectors will use lesson observations, pupils’ work, discussions with teachers and pupils and school records to judge the effectiveness of assessment and whether it is having an impact on pupils’ learning. They don’t need to see vast amounts of data, spreadsheets, charts or graphs. – Sean Harford: OFSTED National Director, Education, 2015.
From: https://www.youtube.com/watch?v=H7whb8dOk5Q
Be ruthless: only collect what is needed to support outcomes for children. The amount of data collected should be proportionate to its usefulness. Always ask why the data is needed.
A purportedly robust and numerical measure of pupil progress that can be tracked and used to draw a wide range of conclusions about pupil and teacher performance, and school policy, when in fact information collected in such a way is flawed. This approach is unclear on purpose, and demands burdensome processes.
The recent removal of ‘levels’ should be a positive step in terms of data management; schools should not feel any pressure to create elaborate tracking systems
Focusing on key performance indicators reduces the burden of assessing every lesson objective. This also provides the basis of next steps: are pupils secure and can pupils move on, or do they need additional teaching?
From:
‘Progress became synonymous with moving on to the next level, but progress can involve developing deeper or wider understanding, not just moving on to work of greater difficulty. Sometimes progress is simply about consolidation.’
From:
“We want to see the assessment information you use as a school to identify how well your pupils are progressing in your curriculum and, crucially, how you use that information to improve pupils’ achievement.” Sean Harford
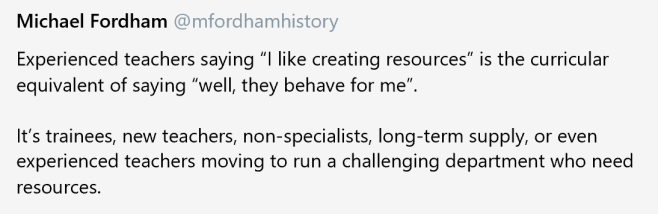
And then today, Sean has both ‘liked’ and retweeted this Tweet of mine:

However, some of Ofsted’s foot soldiers still appear not to have yet got this message. A report published on May 25th 2017 had as a key issue
- There is not enough emphasis on the measurement of pupil progress from individual pupil starting points.
But that was nearly a year ago. Maybe things have improved since then? To find out, I decided to read all the areas for improvement in Ofsted reports for primary schools published in March. However, that runs to over 70 pages, so I gave up after reading 7 pages worth of reports. With 10 schools per page – that’s 70 reports I read. To be fair, most of them seemed sensible enough, but I found a fair few recommendations that worried me. All of the following are all recommendations from reports published in March 2018. I have highlighted in bold the problematic parts.
- ensuring that success criteria regarding pupils’ progress and attainment in performance management documents and in the school’s development plan are measurable, to hold teachers more clearly to account for the achievement of pupils in their classes.
I’m not sure how this can mean anything other than reducing progress to a numerical score? As James Pembroke says ‘numbers in a tracking system do not prove that pupils have made progress; they just prove that someone has entered some data into the system.’
- assessment information is accurate and used alongside improvement plans that have precise objectives and clear measurable outcomes, in order for academy committee members to further hold leaders to account
- leaders’ plans for school improvement and the use of the pupil premium have clear actions, timescales and measurable outcomes
Again, an emphasis on measuring the unmeasurable – a desire for the false illusion of accuracy that measuring something purports to bring.
- outcomes of groups of pupils, no matter how small, are reviewed more precisely, so that leaders know whether their actions to raise standards are effective and represent good value for money
- action plans contain precise success criteria, with specific targets for groups and cohorts of pupils, so that leaders and governors are able to check the impact of their actions on improving outcomes for pupils
With both ASP and the Ofsted dashboard moving away from looking at smaller groups, it is alarming to see this in recent reports.
- they strengthen their analysis and evaluation of the progress of different groups so that they know how well different groups of pupils are progressing
Indeed, even this one bothers me. Why can’t we just check and respond on a pupil by pupil basis? How does it actually help any child do better if leaders are spending precious time analysing groups? Even bigger groups? Especially in year. At the end of the year, then yes, I’d have a look at how pupil premium children were doing compared with non-pupil premium. And obviously at the end of a key stage a whole raft of data is produced. But I’d rather spend my time improving the curriculum and teaching than making pretty charts on excel.
Then there is the question of whether ‘tracking’ really means ‘have a spreadsheet with numbers.’ See for example, these recommendations.
- systems for tracking the progress of pupils in subject-specific skills across the curriculum in subjects other than English and mathematics are embedded
- track the progress of pupils so that governors, middle and senior leaders are fully informed about the progress of groups of pupils, particularly across the wider curriculum.
So they want information about how different groups are doing in geography then, do they?
These two might not mean ‘have a spreadsheet for the other subjects, but that’s probably not how it is going to be interpreted.
So much for being ruthless and only collecting what is needed to support outcomes for children!
Be that as it may, we are doing our best to go ‘data naked,’ by which I mean having the least data we possibly can, only resorting to numbers if they actually tell us something that will enable someone to do something that will make things better for the children as a result. I’m not sure we’ve got it all right and it is still very much a work in progress, but this is what we currently do. I am not holding this up as a marvellous example for others to follow. We are currently due Ofsted, so, not quite holding my nerve, in September our assessment plan included more data than I really thought necessary. While I believe that Sean Harford means what he says, I get nervous about individual inspectors – so the plan included data as a sort of security blanket or lucky amulet to bewitch any data-besotted inspector. However, the plan did not survive contact with reality. Either that, or I just got braver.
Maths
We started the year intending to carry on from the previous year using the PUMA standardised tests at the end of each term. The standardised scores from these were then entered into, yes, you guessed, a home-made excel spreadsheet, which was formatted to colour code certain ranges of scores, based on benchmarks suggested by the publishers of PUMA. The idea being we could have a column with the previous scores from July alongside the December scores, thus being able to make useful comparisons over time. Is Abdul still ‘green’? Why has David done from ‘orange’ to ‘red’? In other words, pseudo-levels.
However, come December, the year 2 and 6 teachers asked if they could do a previous SATS paper instead – which seemed liked a sensible idea. That immediately meant that the December results could not be directly compared with the previous July ones, since the children were taking a test intended for several months later. These results were worthwhile though, and gave us a rough but useful indication of who was ‘on track’ or ‘behind’ or ‘ahead’ given their ks1 score or EYFS score. Everyone else did PUMA but came up against the obvious problem that when you take these kind of tests in year, they don’t necessarily test what you have taught. In other words, it was pretty meaningless except as a way of the individual teachers checking if those questions they had actually taught had been answered correctly. So any attempt to check progress from the previous July was futile. For year 1, the situation was even worse as they were being compared to FSP outcomes. Nevertheless, we valiantly attempted to crunch data and report to our standard and curriculum committee. We even analysed groups – though only boys, girls and pupil premium vs non pupil premium. However, by the time we’d explained for the umpteenth time that ‘you can’t really compare December results with July results’, the governors looked at us all funny and asked us why we were wasting time on in depth analysis of something patently not suitable for such treatment. Then when we tried to talk about groups –and some of our classes are small with only 18 pupils in – it got even more farcical. Governors and leaders together resolved not to waste any more time analysing stuff that was not properly analysable.
So this term, year 2 and year 6 are doing another sats paper, and everyone else is either doing PUMA or White Rose – whatever best fits what they have actually taught so far – but they are doing these assessments not so the SLT can analyse and draw (highly dubious) conclusions. Instead, they are doing them to inform their own teaching so they know what needs more revising and who might need more supporting. At our next pupil progress meeting we will have a conversation about each pupil, and how they did on whatever tool the teacher used will be discussed as a possibly useful starting point. Where pupils do not appear to be doing so well, we will have a look at their maths book to see if that sheds any light on the situation. I will also look at the tracker that tells me if the child knows their number bonds and timetables. I will ask the teacher if there were any particular areas of maths where many children did badly in questions, and if so, what are they going to do about it.
Then in July, everyone (except Early Years and years 2 and 6) will take PUMA (because by then, everyone should have taught the year’s curriculum, so the test:curriculum misalignment problem should not arise) and then I will enter those scores against last July’s scores. I can see a point of data tracking year on year. I can see how that can flag up potential problems either for a child or teacher. But within year, talking to the teacher about their class, looking at books, watching lessons and tracking acquisition of key number facts is much more useful than wasting hours with a spreadsheet.
I should add that, as an experiment, this year we bought into Star Maths (part of the Accelerated Reader package from Renaissance Learning) for years 5 and 6. This enables pupils to do a maths test in a matter of minutes, with no marking for the teacher, and result instantly available (and analysis of what the pupil can and can’t do). Apparently, according to @MrLearnwell, these results correlate very well with actual sats performance. Renaissance Learning bought the anonymised sats data from the government and matched (via UPN) actual sats results with performance of the thousands of children who use their product and got a very high level of correlation. I will wait and see how this bears out for us when this year’s sats results are out, but it may be that from next September we use Star Maths across the school. I don’t understand the product enough yet to understand how it gets round the curriculum: test misalignment problem that happens in year. That’s something I need to find out more about.
Reading
We abandoned PIRA (twin sister of PUMA) this year as we didn’t find it helpful at all. It’s nothing like actual SATS papers, some questions are really odd and all in all, it’s not a good assessment. Several other people have contacted me via Twitter to express the same opinion. Instead, we use Accelerated Reader to find out all sorts of useful things. As well as getting a standardised score from Star Reader, it also gives us a fluency measure, a reading age and, best of all, how many minutes of independent reading each child is doing. This kind of granular information is so much more useful than a test score and really helps us pinpoint what needs more attention. For children in Reception and KS1, (or for older children where appropriate) we also track their progress in phonics. As with maths, all of this information is discussed for each child in our pupil progress meetings and where there are problems, strategies are decided. Years 2 and 6 do previous Sats papers in December and March, in part to give children practice of the format.
Writing
Last year we bought into a tracker system that had every objective for the year. It took a lot of teacher effort for practically no impact on children. Indeed, by focusing on the objectives for that year, it drew teachers’ attention away from objectives in lower year groups that might urgently need attention. Yes, full stops, I’m looking at you. So this year we’ve invented our own really minimal writing objectives tracker for ks2. This starts with the year 2 interim framework objectives, then builds from there, with each year group having 4 or 5 further key objectives, drawn from the national curriculum. So each ks2 teacher checks off the previous year groups objectives first, starting with the year 2 ones. It’s quick and makes sure teachers address learning gaps. On top of that, we are involved in the Sharing Standards comparative judgement project from No More Marking. This gives us a good measure of how well we are doing as a school in relation to other schools, as well as giving each child a scaled score. This scaled score is only based on one piece of work, but a useful starting point for discussion and enables us to target book looks on those children who seem to be doing worse than we would have expected, given their prior attainment. Added to that, it means every teacher has seen a piece of work from every child in the school from year 1 upwards and I have instant access to that work from my computer.
History, geography, science, RE
Children do a multiple choice quiz at the end of each unit. The score out of 10 (or 5 in ks1) gets recorded on a spreadsheet. Then a couple of months later (when that unit has long finished) they do another quiz on that subject. That score is also recorded. Then at the end of the year they do a quiz of quizzes, with questions from all the units that year. And guess what – that score gets recorded too, and goes on end of year report. I was really worried about assessing the foundation subjects when this first became a thing, but actually, this system works really well, is quick and easy and has impact. It allows us to identify which questions children are finding harder and which children are not doing as well as they should. In order to assess children’s ability to apply knowledge, we have just started using stem sentences and ‘but, because, so’ to see if children can put their knowledge to work. For example, given the stem sentence, ‘the River Nile used to flood each year…’ can the children carry on this sentence 3 different ways, using but, because and so? For example, the River Nile used to flood each year but does not any more since the Aswan dam has been build. Or, the River Nile used to flood each year so the land became very fertile from all the minerals in the floodwater. At the moment this is mainly formative, but we may also weave it into their end of unit assessment once children are more familiar with the process.
MFL is similar with end of unit quizzes, but I haven’t got round to having them on a spreadsheet yet.
Computing
This is still under development and not yet available for every class. Children start each coding unit with screenshots of various bits of code (usually from Scratch). They write what they think this code might do. Then at the end of the unit, they get the same screenshots and again write descriptions – which are of course then much more accurate and detailed. Nothing gets put on a spreadsheet. Ironically the computing assessment is the most low-tech! The assessment helps the teacher see how effective they have been and which aspects were the least successful. Children like seeing how much they have learnt. So I am quite happy with this system. In addition, we have a multiple choice quiz on online safety, which the children do every term. Yes, the questions are the same, because it’s not about progress, it is about keeping the children safe.
PE, art, DT and music
We have a PE coach who takes all PE lessons. He has this massive spreadsheet with 3 or 4 objectives from each sport plus one for being a good team player. Hand on heart I have no idea if it actually has any impact on children’s progress in the subject but he said he had all that information anyway and was happy to do it.
We have a similar system for art and DT (though much shorter). I’m not wedded to the idea. We have also started doing simple assessments of children’s ability to copy patterns of increasing complexity – starting with just a line and getting progressively harder, the child stopping at the pattern they find difficult to copy. I think this is much more likely to be useful.
And as for music…er…I confess we don’t have a system yet for music.
Reporting to governors and parents
The great thing about graphs and charts is they make complex information understandable. The downside is they give the illusion of making flawed information meaningful. They enable comparisons but at a cost; everything has to be reducible to a number. This is a cost I am no longer prepared to pay. But while I think our present way of checking for progress is far superior to previous systems, without a doubt it is harder to report to others in terms of accountability. As you can see, we have different systems for different subjects; some information tracks discrete objectives or behaviours, some is comparative with other schools, some is strictly formative. I can’t reduce this complexity to a numerical value. Governors have to bear with narrative descriptions of how we know about the progress our children are making. Some subjects have some numbers, but the score out of 10 in a history quiz is in no way directly comparable with say, average reading age or the number of number bonds a child in year 1 knows. And as for tracking groups – well – except for at the end of each key stage, we don’t. It doesn’t add any value at all to the achievement of any child so I simply refuse to indulged in such a meaningless ritual.
Reporting to parents, on the other hand is much easier. Parents understand things like a reading age or a score out of 10 or a chart that shows how many times tables or spellings a child knows. That’s far more understandable than being told your child is 3b or ‘emerging plus’ or even ‘working at the expected level.’
And Ofsted?
Maybe I’ll just give them this to read?
[1] Yes, I know I’ve made that joke before. It’s good though, isn’t it, even though I say so myself.
[2] Read this excellent blog which says everything I am saying, only better, and from which I have drawn extensively in this blog